
Progress tracking is central to keeping a project moving, yet teams often approach it in very different ways. Some want to record precise progress using percentage complete. Others simply want to know whether a task has started, is underway, or is finished.
Smartsheet supports both approaches, and choosing the right one can make day‑to‑day updates noticeably easier. If you want to use the Board view to drag-and-drop from one status to another (the Kanban way), then the simpler approach is for you, but needs a bit of set-up – download the free template to get started faster.
Here we provide an overview of both methods used across project teams and explain how they behave inside Smartsheet.
Percentage Complete: The Traditional Method
Most structured project plans use a % Complete column. It allows teams to indicate progress at a granular level, and formulas can translate these numbers into a simple status:
This method works well when accurate measurement matters or when reporting depends on numeric progress. It also integrates cleanly with Gantt charts and dashboards.
However, some teams find it more detailed than necessary, especially when task owners simply need a quick way to confirm movement.
A Simpler Approach: Not Started, In Progress, Complete
For teams that prefer straightforward updates, a three‑stage dropdown is often easier:
This replaces formula‑driven logic with a manual status selection. But on its own, this wouldn’t update the % Complete value – which is why many teams pair it with lightweight automations where the % complete is still used.
Automations That Keep the Data Aligned
Two automation rules are usually enough:
This gives users a simple input while still keeping Gantt charts and dashboards consistent. Parent rows remain unaffected, as Smartsheet calculates their progress based on underlying tasks.
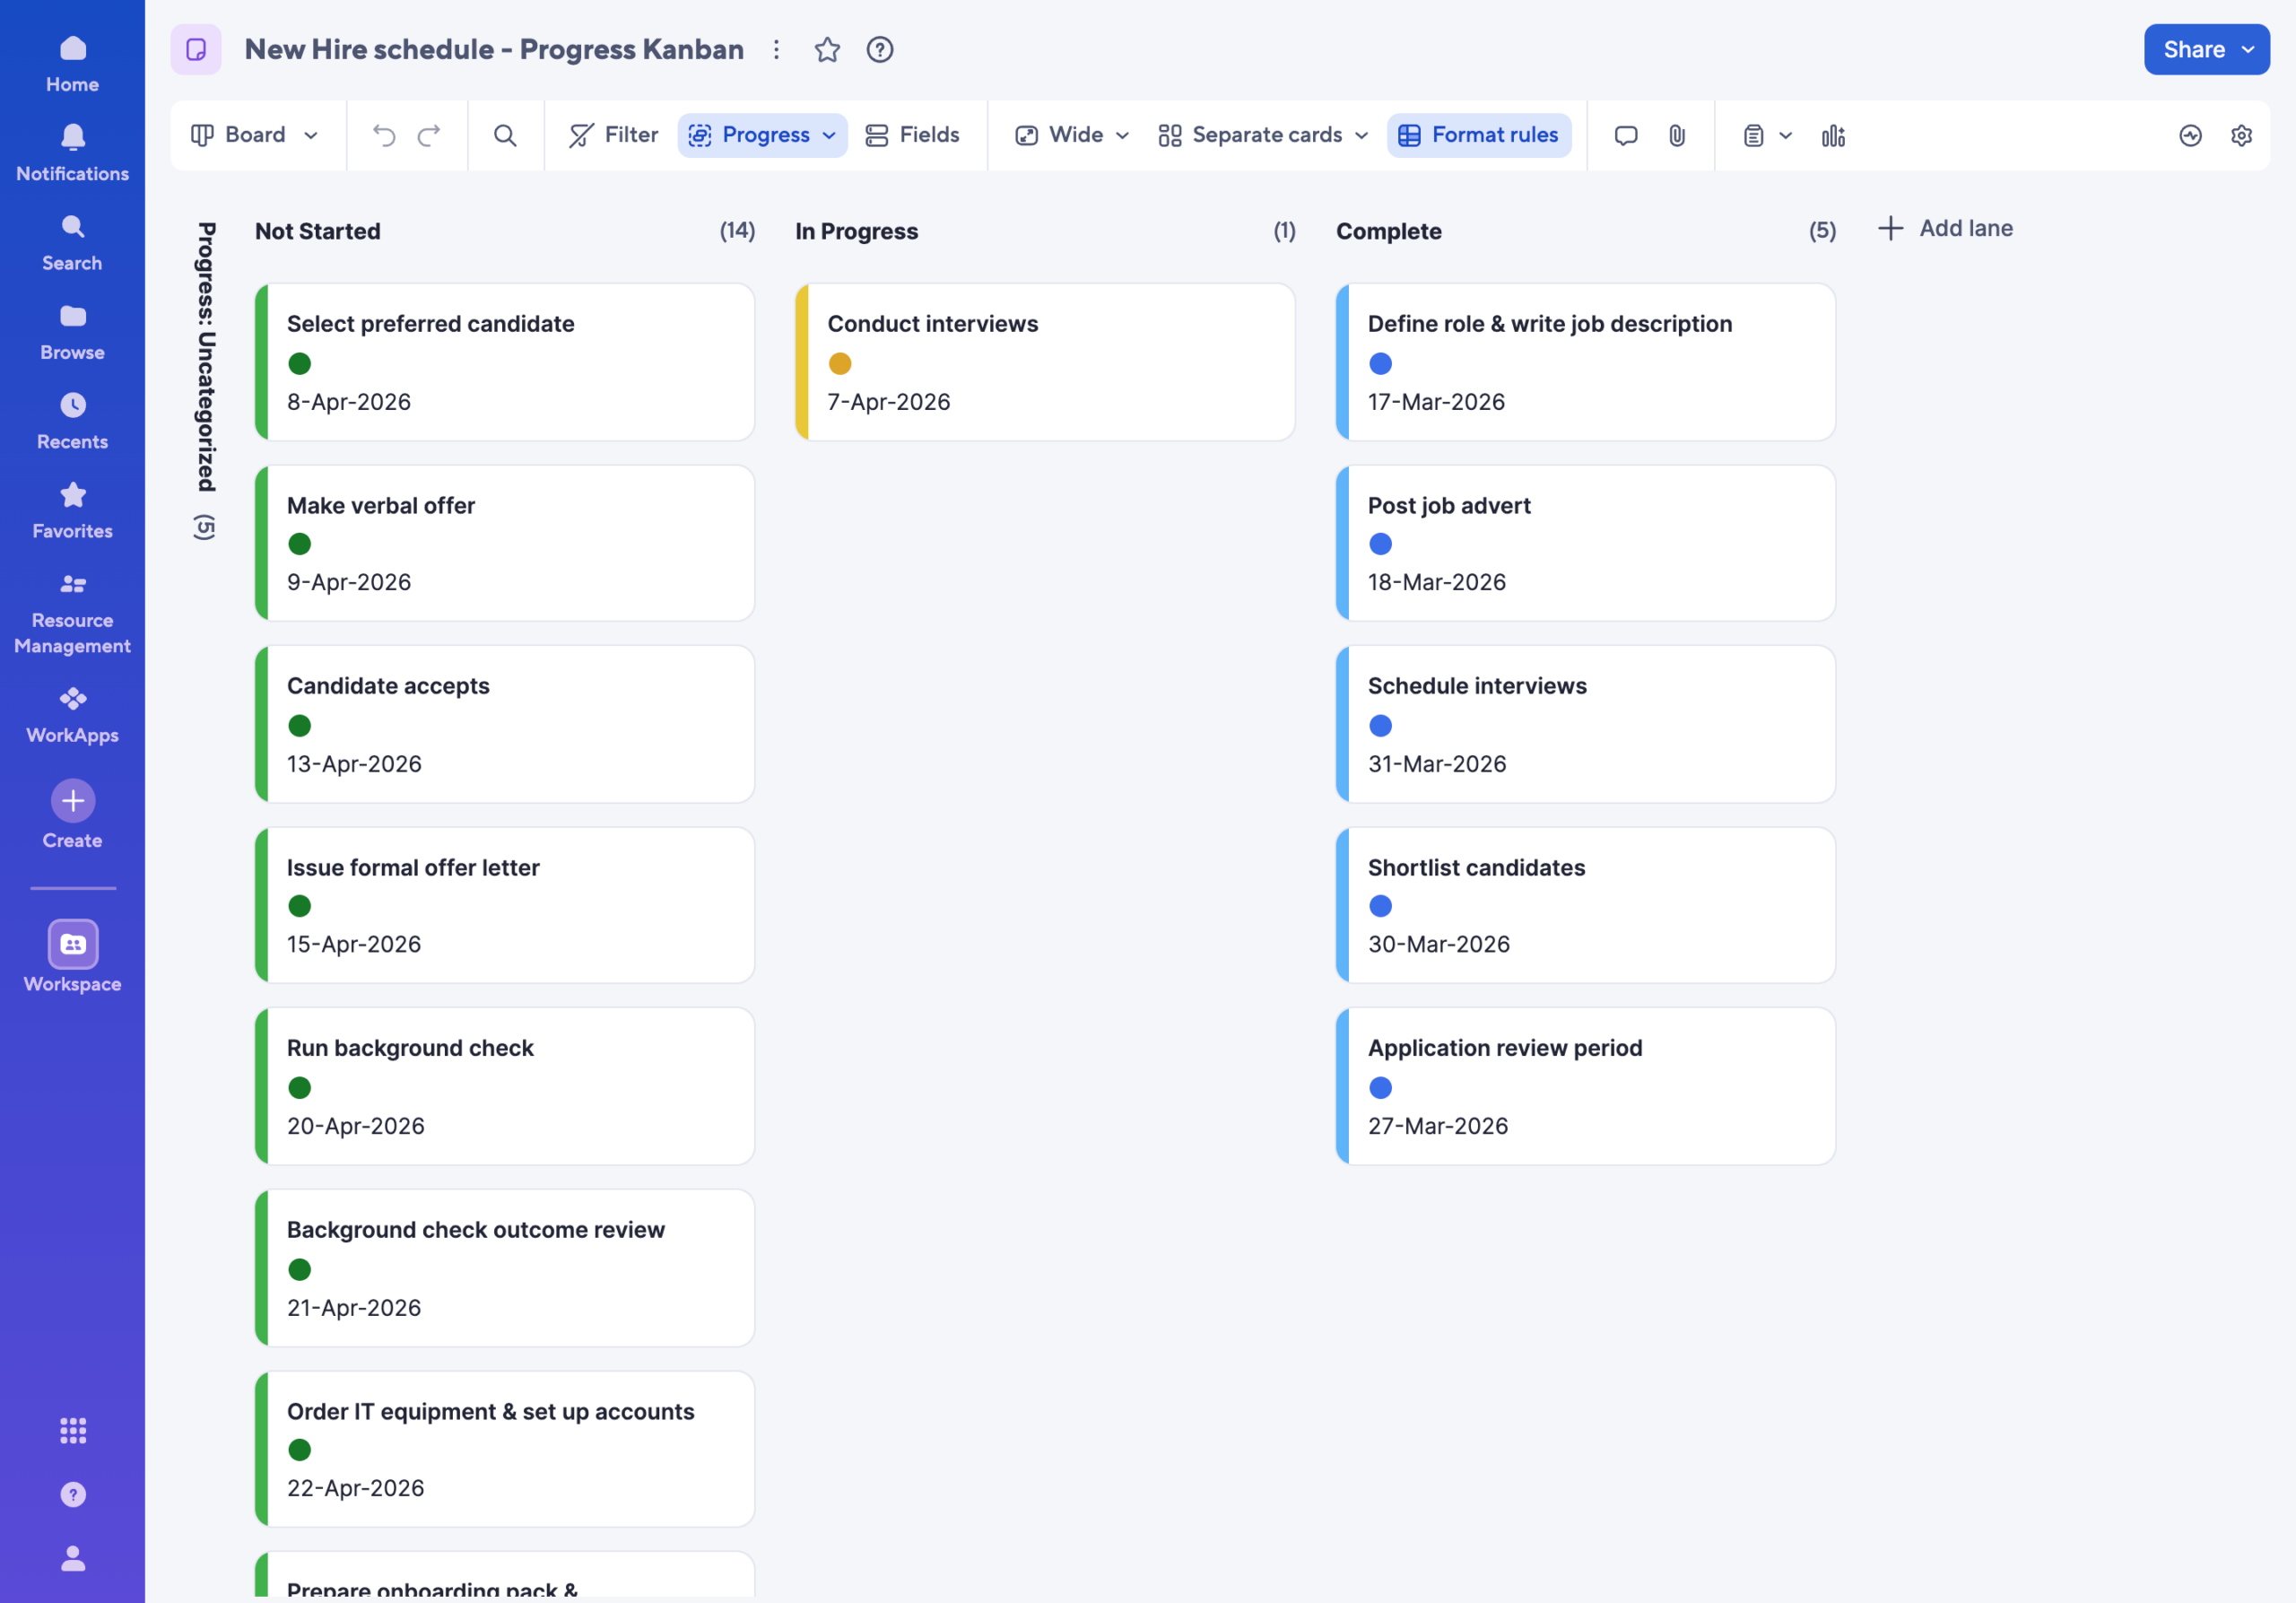
Unlocking Board View With Simple Status
One significant advantage of the simple status method is that it enables Board View.
When a progress column contains formulas, Smartsheet prevents drag‑and‑drop movement between lanes. Switching to manual status removes this restriction, allowing tasks to be moved visually between:
This is especially useful for teams running stand‑ups or adopting a Kanban-style workflow. As tasks move on the board, automations update the associated percentage values automatically.
When to Choose Each Method
Both options work effectively; the right choice depends on the team’s needs.
Use Percentage Complete when:
Use Simple Status + Automations when:
Each option maintains data integrity, supports dashboards, and works with dependencies.
Summary
Smartsheet offers flexibility in how progress is recorded, and both methods – detailed percentages or simple status steps – provide reliable ways to keep a plan updated. The key is selecting the model that aligns with how the team actually works, not just the model that appears most sophisticated.
With the right setup, either method can support accurate schedules, clear dashboards and efficient project delivery.
Any questions, get in touch!


Progress tracking is central to keeping a project moving, yet teams often approach it in very different ways. Some want to record precise progress using percentage complete. Others simply want to know whether a task has started, is underway, or is finished.
Smartsheet supports both approaches, and choosing the right one can make day‑to‑day updates noticeably easier. If you want to use the Board view to drag-and-drop from one status to another (the Kanban way), then the simpler approach is for you, but needs a bit of set-up – download the free template to get started faster.
Here we provide an overview of both methods used across project teams and explain how they behave inside Smartsheet.
Percentage Complete: The Traditional Method
Most structured project plans use a % Complete column. It allows teams to indicate progress at a granular level, and formulas can translate these numbers into a simple status:
This method works well when accurate measurement matters or when reporting depends on numeric progress. It also integrates cleanly with Gantt charts and dashboards.
However, some teams find it more detailed than necessary, especially when task owners simply need a quick way to confirm movement.
A Simpler Approach: Not Started, In Progress, Complete
For teams that prefer straightforward updates, a three‑stage dropdown is often easier:
This replaces formula‑driven logic with a manual status selection. But on its own, this wouldn’t update the % Complete value – which is why many teams pair it with lightweight automations where the % complete is still used.
Automations That Keep the Data Aligned
Two automation rules are usually enough:
This gives users a simple input while still keeping Gantt charts and dashboards consistent. Parent rows remain unaffected, as Smartsheet calculates their progress based on underlying tasks.
Unlocking Board View With Simple Status
One significant advantage of the simple status method is that it enables Board View.
When a progress column contains formulas, Smartsheet prevents drag‑and‑drop movement between lanes. Switching to manual status removes this restriction, allowing tasks to be moved visually between:
This is especially useful for teams running stand‑ups or adopting a Kanban-style workflow. As tasks move on the board, automations update the associated percentage values automatically.
When to Choose Each Method
Both options work effectively; the right choice depends on the team’s needs.
Use Percentage Complete when:
Use Simple Status + Automations when:
Each option maintains data integrity, supports dashboards, and works with dependencies.
Summary
Smartsheet offers flexibility in how progress is recorded, and both methods – detailed percentages or simple status steps – provide reliable ways to keep a plan updated. The key is selecting the model that aligns with how the team actually works, not just the model that appears most sophisticated.
With the right setup, either method can support accurate schedules, clear dashboards and efficient project delivery.
Any questions, get in touch!