Gantt Charts: Beginner to Advanced

Check out our series of resources for Gantt charts

A well‑built Smartsheet Gantt chart provides a structured, dependable project plan that adapts automatically as work progresses. When combined with Prodactive’s best‑practice template, teams benefit from clear hierarchy, consistent formatting, accurate scheduling logic, and meaningful roll‑ups.

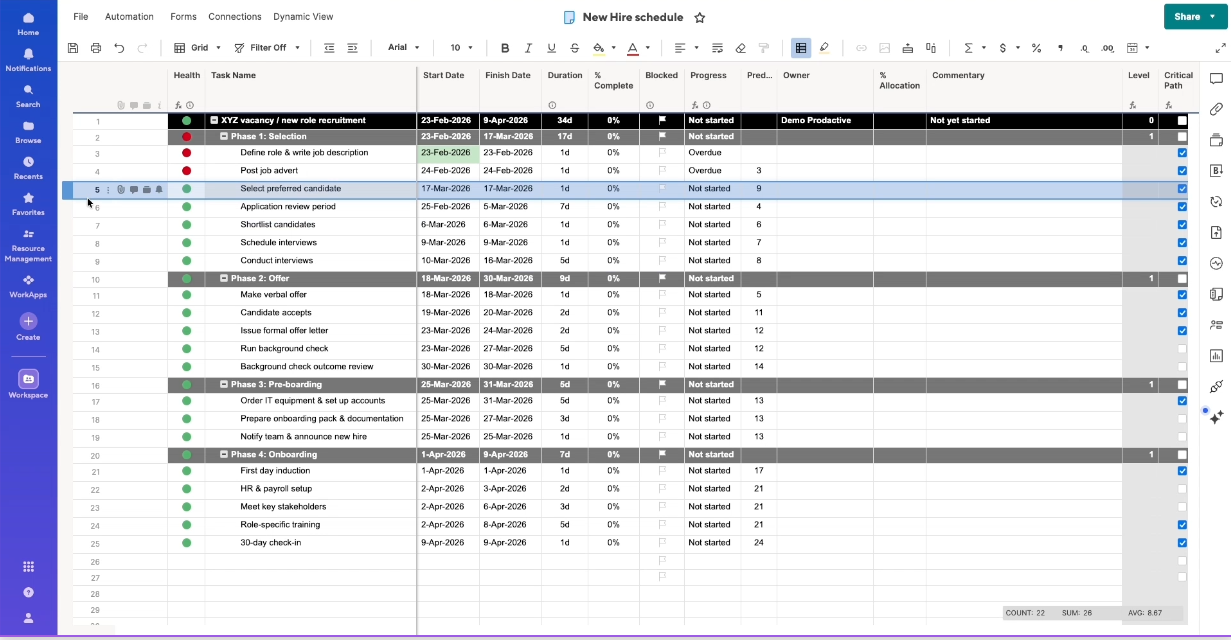
By integrating fully with Smartsheet’s collaboration tools, automations, and reporting capabilities, the Gantt chart becomes more than a visual timeline—it becomes a central workspace for managing tasks, communicating with stakeholders, and staying ahead of risks. Whether managing a single project or a multi‑phase programme, this approach keeps your plan organised, up‑to‑date, and easy for everyone to understand.


Solution Overview

What you’ll need

Smartsheet Core

Complexity

All levels

What’s Included

  • Core Gantt Structure
    • Tasks, start and finish dates, durations, and supporting project details form the foundation.
    • Once date columns are set, switching to Gantt view displays the visual timeline.
    • Dependencies can be enabled to automatically adjust linked tasks using common predecessor types (FS, SS, FF, SF) and optional lag times.
  • Timeline & Working Day Customisation
    • Configure working days to match your organisation’s schedule.
    • Adjust the timescale to view the project by days, weeks, months, or longer periods.
    • Set the Gantt to open on today’s date for easier, up‑to‑date navigation.
  • Hierarchy & Roll‑Ups
    • Indent rows to create phases, sub‑tasks, and parent roll‑ups.
    • Parent rows auto‑calculate progress based on the tasks beneath them.
    • Templates often use conditional formatting to visually differentiate hierarchy levels.
  • Status, Risk & Scheduling Visibility
    • Conditional formatting helps highlight overdue or at‑risk tasks.
    • Baselines allow comparison between the original plan and the current schedule.
    • Critical path highlights the tasks that determine the earliest possible project completion.
  • Flexible Editing & Data Control
    • Drag‑and‑drop tasks and columns to reorganise the plan.
    • Choose the right column types for dates, durations, dropdowns, contacts and more.
    • Use the sheet summary panel for key metrics and dashboard‑ready information.
  • Collaboration Tools
    • Add attachments, comments, proofing items, and @mentions directly to tasks.
    • Automations can send reminders, trigger alerts, request updates, or manage logic-based workflows.
    • Filters make it easy to isolate critical path items, active tasks, or any custom view.

Overview

Gantt charts in Smartsheet provide a clear visual timeline of your project, showing how tasks connect, where dependencies lie, and how delays impact the overall schedule. They update automatically as tasks shift, giving teams a reliable, real‑time view of progress.

What you’ll need

Smartsheet Core

Complexity

All levels

What’s Included

  • Core Gantt Structure
    • Tasks, start and finish dates, durations, and supporting project details form the foundation.
    • Once date columns are set, switching to Gantt view displays the visual timeline.
    • Dependencies can be enabled to automatically adjust linked tasks using common predecessor types (FS, SS, FF, SF) and optional lag times.
  • Timeline & Working Day Customisation
    • Configure working days to match your organisation’s schedule.
    • Adjust the timescale to view the project by days, weeks, months, or longer periods.
    • Set the Gantt to open on today’s date for easier, up‑to‑date navigation.
  • Hierarchy & Roll‑Ups
    • Indent rows to create phases, sub‑tasks, and parent roll‑ups.
    • Parent rows auto‑calculate progress based on the tasks beneath them.
    • Templates often use conditional formatting to visually differentiate hierarchy levels.
  • Status, Risk & Scheduling Visibility
    • Conditional formatting helps highlight overdue or at‑risk tasks.
    • Baselines allow comparison between the original plan and the current schedule.
    • Critical path highlights the tasks that determine the earliest possible project completion.
  • Flexible Editing & Data Control
    • Drag‑and‑drop tasks and columns to reorganise the plan.
    • Choose the right column types for dates, durations, dropdowns, contacts and more.
    • Use the sheet summary panel for key metrics and dashboard‑ready information.
  • Collaboration Tools
    • Add attachments, comments, proofing items, and @mentions directly to tasks.
    • Automations can send reminders, trigger alerts, request updates, or manage logic-based workflows.
    • Filters make it easy to isolate critical path items, active tasks, or any custom view.

Demo of Working Day Hours in Gantt Chart 

Create Project Timeplans with Gantt Charts

Sheet Hierarchy Overview

More Resources from Prodactive

Want to find out more?

Use the link below to get in touch or book a meeting with one of our team.

Rich Coles

Founder &
Managing Director

Suzie Alloway

Head of Project & Programme Management

Gantt Charts: Beginner to Advanced

Check out our series of resources for Gantt charts

Download Files

Files are available for this Demo. Enter your email address below to download the files and agree that you would like to receive marketing communication from Prodactive.

More Demo Assets from Prodactive

Learn how we helped 100 top brands gain success

Learn how we helped 100 top brands gain success

Thank you for choosing to register for Smarthub’s Early Access Programme: 

Please select your Region (note that you need to be logged into Smartsheet to access the registration form)